

Ever feel like you’re flying blind with your online presence? You’re not alone. Many treat their digital strategy like a magic eight ball – just hoping for good answers.
Here’s the reality: analytics is your control panel. It’s the art of understanding user behavior through data collection and interpretation. Think of it as having X-ray vision into what makes your audience tick.
This isn’t about counting visitors like a digital bouncer. It’s about revealing actionable insights that transform guessing games into laser-focused strategy. From page visits to button clicks, every interaction tells a story.
Tools like Google Analytics provide real-time data that steers your digital experience toward desired outcomes. Without this intelligence, you’re basically using a flip phone at a Silicon Valley conference.
The real power? Turning raw numbers into strategic decisions that actually move the needle.
Setting Up Google Analytics
Setting up Google Analytics is like putting together IKEA furniture. It seems hard at first, but it’s easier once you have the instructions. You don’t need a computer science degree; just basic computer skills and patience.
First, make a Google Analytics account with an email you’ll remember. Don’t use an old email from 2007. Then, install the tracking code on your website. It’s like adding a legal tracking device.
For WordPress users, Jetpack Stats is a simpler option. It doesn’t need technical skills. Just install the Jetpack plugin, connect to WordPress.com, and your analytics will start working.
Google Analytics works well with Google Ads, which is great for ads. This means your traffic reports will show how ads and organic traffic perform together.
Here’s a comparison of setup methods:
| Platform | Setup Complexity | Best For | Integration Features |
|---|---|---|---|
| Google Analytics | Moderate | Detailed data analysis | Full Google ecosystem |
| Jetpack Stats | Easy | WordPress beginners | Built-in WordPress features |
| Google Analytics + WordPress | Advanced | Technical users | Custom tracking options |
Remember, setting up analytics without knowing what to track is like buying a sports car and never driving it. The tools are powerful, but they’re useless without a plan.
Your new data dashboard will become your favorite show. It will tell you about your audience’s behavior and preferences.
Reading Key Metrics
Ever feel like you’re reading hieroglyphics when you open your analytics dashboard? You’re not alone. The secret isn’t memorizing every metric – it’s knowing which ones actually matter for your goals.
Let’s start with the basic visitor metrics. Sessions tell you how many times people entered your digital storefront. Unique visitors show how many individual humans actually showed up. Think of it like a concert: sessions are total ticket scans, while unique visitors are the actual audience size.
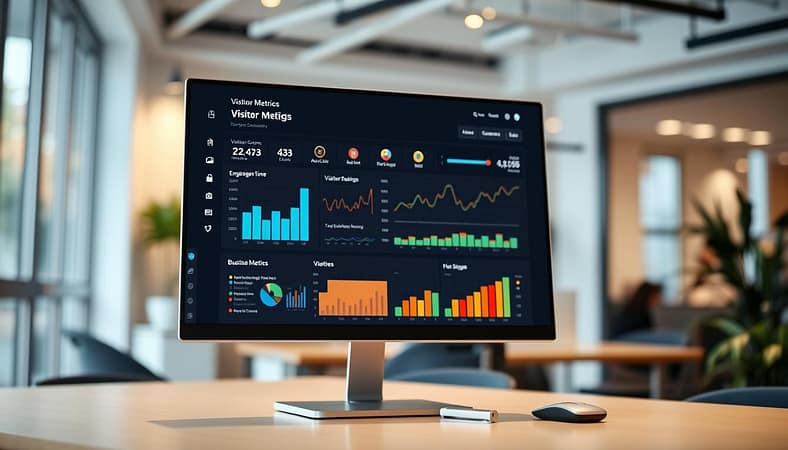
Now for the real insights. Bounce rate reveals who took one look and left immediately – the digital equivalent of walking into a party and walking right back out. A high bounce rate might mean your content isn’t matching what people expected.
But here’s where it gets interesting. That 28% “view item list” event rate? That’s gold. It means people are actually engaging with your products, not just looking. These engagement metrics tell you what people are doing, not just that they showed up.
Key metrics to watch:
- Sessions vs. Users: Are you getting repeat visitors or just one-timers?
- Bounce Rate: Is your content meeting expectations?
- Conversion Rate: The standing ovation metric – are people taking action?
- Pages per Session: How deep are people diving into your content?
The real art? Looking at these visitor metrics in combination. One metric alone is about as useful as a screen door on a submarine. High traffic but low conversion? You’re attracting the wrong crowd. Low traffic but high conversion? Your content works – you just need more visitors.
Remember: analytics isn’t about collecting data. It’s about finding stories in the numbers. The right metrics tell you what’s working, what’s not, and where to focus your energy next.
Finding Your Top Pages
Ever wonder which web pages are really working for you? It’s like watching a reality show where the underdog wins. Your analytics dashboard shows these surprises.
Top pages show what content really connects with your audience. They’re not always the ones you spent months on. Sometimes, a quick blog post can outshine your big project.
GA4’s “Pages and Screens” report shows where the action is. You’ll see views, active users, and how long they stay. This data tells you what content keeps people engaged and what loses them.
Here’s what to look for in your top performers:
- Session duration – How long people stay
- New vs returning users – Who’s finding you
- Conversion rates – Where magic happens
- Bounce rates – Where interest drops
The real insight is in comparing expected vs actual performance. That product page with confusing navigation might be your top converter. Your beautiful homepage? It might just be a pretty doorway to better content.
Measuring growth through top page analysis gives you clear direction. It tells you what to create more of and what to improve. These insights help you focus your efforts where they’ll make the most impact.
Remember: Your audience votes with their clicks every day. Your top pages are the election results showing what they really want.
Using Data for Growth
Your analytics dashboard is like a magic crystal ball. It works if you ask the right questions. I’ve seen businesses turn problems into opportunities by listening to their Google Analytics data.
That high bounce rate on your checkout page? It’s like customers saying your payment process is too hard. And those quick exits on social media? They show your Instagram doesn’t match your website.
Analytics is more than just a report card. It’s a continuous conversation. Every metric is a customer whispering what they want from you.
Here’s how to grow using data:
- Troubleshoot customer experience by finding where visitors leave quickly
- Address pain points by analyzing behavior like a detective
- Focus on best-performing content and treat it like royalty
Your marketing campaigns become experiments you can measure. Click-through rates, bounce rates, and conversion rates guide you. They show what works and what doesn’t.
The best growth hack? Use analytics for retargeting. You can offer personalized content that turns leads into customers.
Remember, data doesn’t lie, but it needs interpretation. Are you listening to your numbers, or just looking at the charts?
Setting Traffic Goals
Ever tried dieting without a scale? You might feel lighter, but you’ll never know your actual progress. Setting traffic goals without proper analytics works the same way – it’s digital guesswork.
“More visitors” is like wanting to be happier. It sounds nice but means nothing. Companies often celebrate traffic spikes while their conversion rates plummet.
The magic happens when you ask the right questions before looking at your traffic reports:
- Am I hunting for new audiences or nurturing returning visitors?
- Should I prioritize traffic volume or conversion quality?
- Is this about quick wins or sustainable growth?
Your answers determine which metrics matter. An e-commerce site might aim for “Increase organic search traffic by 25% while maintaining 2% conversion rates.” A content publisher might want “Reduce bounce rate on article pages by 15% through better engagement hooks.”
The table below shows how different business objectives translate into specific traffic goals:
| Business Type | Primary Objective | Smart Traffic Goal | Key Metric to Watch |
|---|---|---|---|
| E-commerce | Sales Growth | Increase organic traffic by 25% with stable 2% conversion rate | Conversion Rate |
| Content Publisher | Audience Engagement | Reduce bounce rate by 15% on article pages | Bounce Rate |
| SaaS Company | User Retention | Grow returning visitors by 30% quarterly | Returning Visitors |
| Local Business | Community Reach | Increase local search traffic by 40% in 6 months | Geographic Traffic |
Vanity metrics are like empty calories in digital marketing. They look good but offer no real value. A million visitors who never convert is just digital window shopping.
The most sophisticated traffic reports won’t help if you’re chasing the wrong numbers. Set goals that actually move your business forward, not just your ego.
Analytics Glossary
Welcome to the digital Rosetta Stone – where we make analytics easy to understand. Ever felt like your analytics dashboard was a secret language? You’re not alone. Let’s learn about visitor metrics together.
This analytics glossary is your guide when your boss asks about “unique pageviews”. You’ll know exactly what to say.

- Visits/Sessions: Each time someone visits your site. It’s like every time they ring your doorbell
- Unique Visitors: Actual people, not counting their devices. It’s like counting guests, not visits to the buffet
- Page Views: Total pages viewed. It’s like asking how many chapters they read
- Bounce Rate: People who leave after one page. It’s like a digital rejection
- Conversion Rate: How well you meet your goals. It’s like getting a standing ovation
- Traffic Sources: Where visitors come from. It’s like asking “how did you hear about us?” at a party
- Engagement Rate: How interested visitors are. It’s like sessions lasting more than 10 seconds or 2+ page views
Understanding these terms is key. Misunderstanding them is like reading a map upside down. You might end up somewhere, but not where you wanted.
Engagement rate is important. Google says a session is engaged if:
- It lasts more than 10 seconds (not just a quick look)
- Includes a conversion event (they actually did something)
- Has 2 or more page views (they’re exploring)
This shows who’s really interested and who’s just looking for cat memes.
Knowing these visitor metrics terms makes you a digital strategist. You go from just counting numbers to understanding people.
Analytics is about the stories behind the numbers. It’s about real people and their interactions with your content. Now you can impress people at meetings.
How to Track Progress
Tracking analytics is like watching grass grow – except this grass tells you exactly how your business is measuring growth. The real magic happens when you stop staring at numbers and start reading the story they tell.
Your review frequency depends entirely on your business goals. Dynamic sites or short-term campaigns need daily or weekly check-ins. More stable websites might work fine with monthly reviews. Think of it like checking your bank account – you don’t need to watch every transaction, but you should know when something significant happens.
The art lies in distinguishing signal from noise. That 15% traffic drop might look catastrophic until you realize it’s compared to last year’s Black Friday numbers. Context transforms data from panic-inducing to strategy-shaping.
Set up custom alerts in Google Analytics for when metrics deviate significantly from your norms. This way you’re not constantly watching the dashboard, but you’ll know immediately when something requires attention. Being proactive in analytics always beats being reactive.
Regular audits ensure your data stays accurate. Check for missing tracking codes, duplicate tags, or configuration errors that might skew your results. Clean data means clearer insights into your actual progress.
Ultimately, analytics isn’t about watching numbers change – it’s about understanding what those changes mean for your business strategy. The right tracking approach turns raw data into actionable intelligence for measuring growth and making smarter decisions.